Data analysis and stats
Data & statistics
Statistics – country / city / station levels
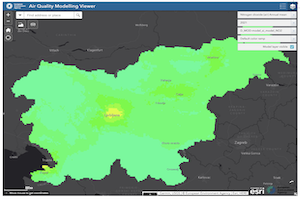
These viewers give a quick overview of the air pollution levels for Particulate Matter (PM10 and PM2.5), Nitrogen Dioxide (NO2) and Ozone (O3) as transmitted by the participating countries to the EEA in the frame of AQ eRep..
The results are presented:
- at the country level: the values are averaged on all measuring stations – direct link: https://tableau-public.discomap.eea.europa.eu/views/AQeRep_for_public_for_portal/Countrydashboard
- at the city level: the values are averaged over all the measuring stations located within in the city – direct link: https://tableau-public.discomap.eea.europa.eu/views/AQeRep_for_public_for_portal/Citydashboard
- at the station level – direct link: https://tableau-public.discomap.eea.europa.eu/views/AQeRep_for_public_for_portal/Stationdashboard
Daily – weekly – monthly viewer
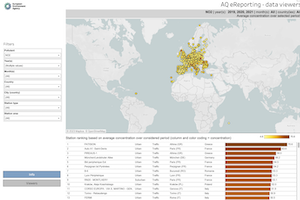
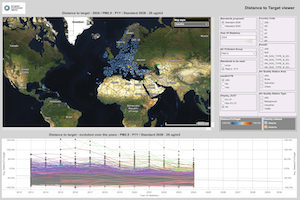
The evolution throughout the year(s) of the daily, weekly or monthly air pollution concentrations can be followed with this viewer at station level. Stations are also ranked according to their level of pollution.
Direct link: https://tableau-public.discomap.eea.europa.eu/views/data_viewer_ng/Home
General statistical viewer
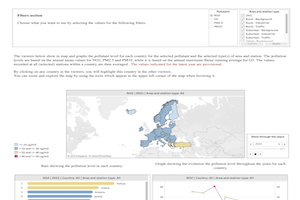
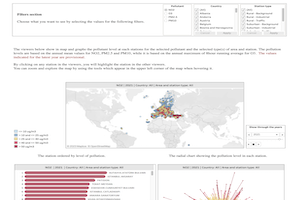
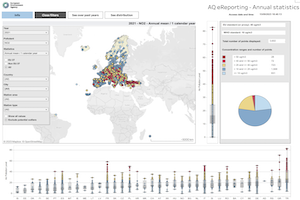
This is the general statistical viewer. It covers all pollutants and all aggregations. Results are presented by year on maps and box plots. Specific screens also show the evolution throughout the years as well as the distribution of the values.
Direct link: https://tableau-public.discomap.eea.europa.eu/views/statistical_ng/General
Correlation tool
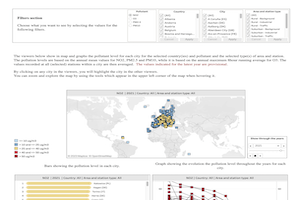
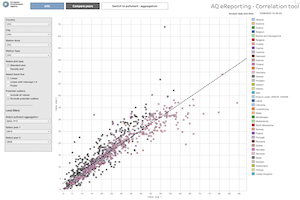
The correlation tool allows to compare different air pollutant/aggregations for the same year(s) or two different years for the same pollutant/aggregation.
Direct link: https://tableau-public.discomap.eea.europa.eu/views/correlation_tool_ng/Compareyears
Models
Modelling results
The results from models transmitted by the Member States are presented here.
Direct link: https://discomap.eea.europa.eu/AirQualityModellingViewer/
