Focus on cities
Statistics in cities
Monthly air quality values originating from AQ e-Reporting as averages (2018 until present) calculated for European cities – direct link: https://discomap.eea.europa.eu/App/AQViewer/index.html?fqn=Airquality_Dissem.cities.MonthlyAirQualityStatisticsInCities
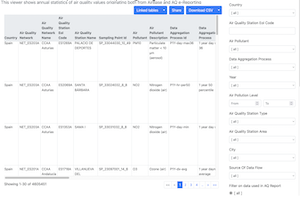
Annual average air quality (PM10 and PM2.5) values in urban areas calculated from AQ e-Reporting data for countries in Europe – direct link: https://discomap.eea.europa.eu/App/AQViewer/index.html?fqn=Airquality_Dissem.csi4.AirQualityInCountryUrbanAreas


City population exposed to air pollution
Urban population exposed to air pollutant (NO2, O3, PM2.5, PM10) concentrations above selected EU air quality standards in the EEA member countries.
Direct link: https://discomap.eea.europa.eu/App/AQViewer/index.html?fqn=Airquality_Dissem.csi4.ExposureSummary
European city air quality viewer (previously City ranking viewer)
Cities (761) are ranked by default from the cleanest city to the most polluted one, based on the risk of mortality associated with long-term exposure to PM2.5, NO2 and O3 over the past 2 calendar years, assuming that the total attributable risk for exposure to several pollutants is the sum of the attributable risk per pollutant.
Air quality maps at 1×1 km2 resolution are used for this analysis. The most updated available maps, either using validated data or UTD data are used to estimate population-weighted concentrations at city level. The mortality risk is estimated using the concentration-response functions as defined in the 2021 World Health Organization (WHO) guidelines for air quality, and counterfactual concentration levels equal to the WHO recommended long-term guidance levels.
Direct link: https://tableau-public.discomap.eea.europa.eu/views/City_AQ_Viewer_2025/EuropeanCityRanking?:device=desktop


